Clustering Illusion (Why do we consider random samples to be non-random?)
The Clustering Illusion, a brief explanation
What is the Clustering Illusion?
The clustering illusion is the tendency to perceive ‘streaks’ and ‘clusters’ as non-random data in random distributions of data.
Example
An investor in the stock market checks a plot of stock value over time before marking an investment. When viewing the plot of data they might believe that there is a trend when in fact there is none.
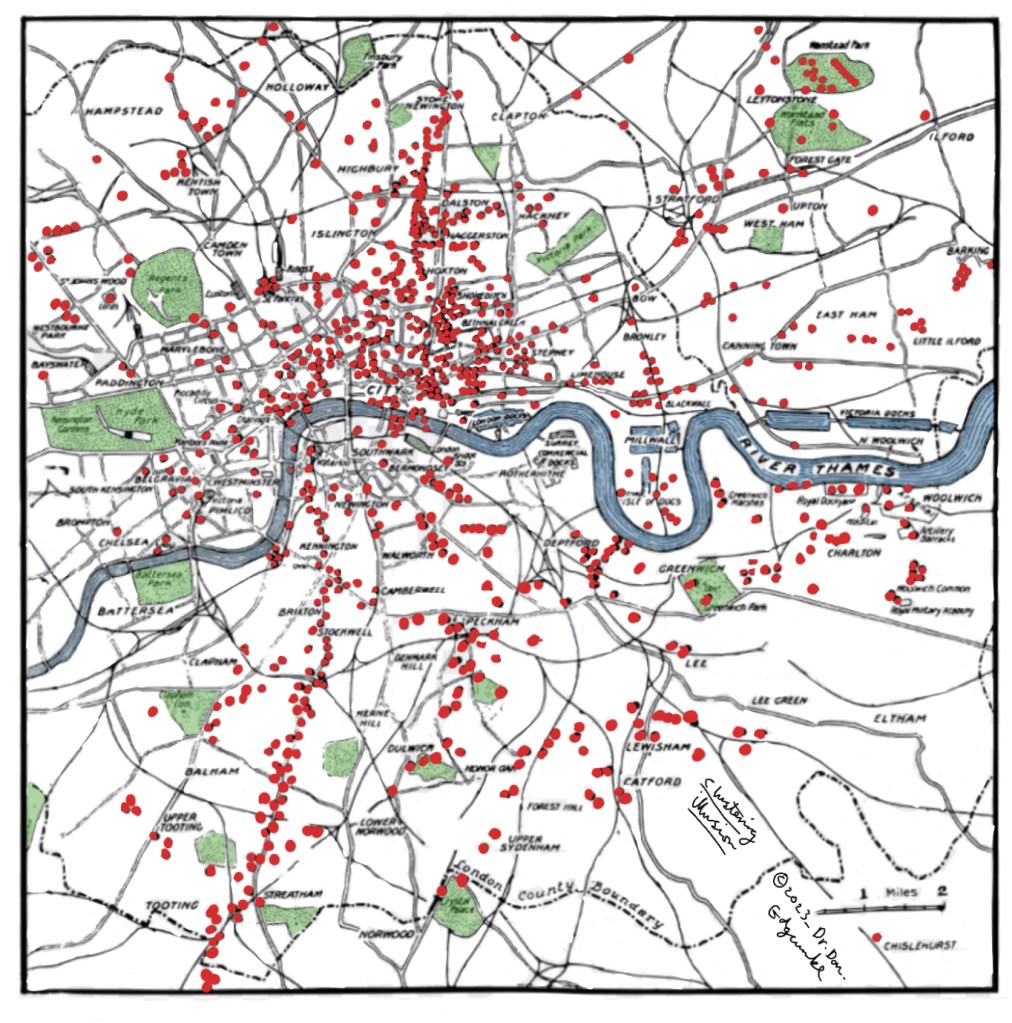
During the Second World War observers looked at the location of bomb hits in London. Although many of the bomb hits were random due to dropping bombs from planes Londoners began to develop specific theories about patterns of impacts across London.
The literature
Bedek, M. A. (2018). Methods for discovering cognitive biases in a visual analytics environment. Cognitive biases in visualizations. Doi: 10.1007/978-3-319-95831-6_5
Howard, J. (2018). Illusionary correlation, false causation, and clustering illusion. Cognitive errors and diagnostic mistakes. Doi: 10.1007/978-3-319-93224-8_15
